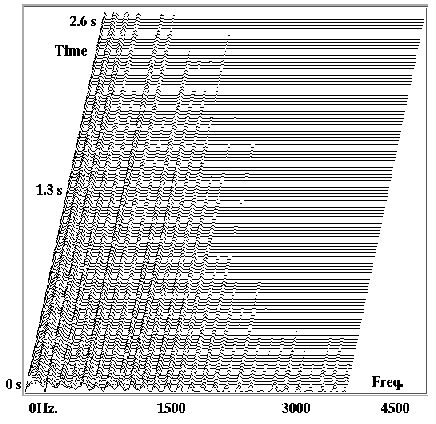
Waterfall spectrum plot of
single guitar note. Frequency
is shown on the horizontal
axis, and time is shown
angling upward to the right.
What is shown here is that a
plucked guitar string begins
with a noisy attack, which
very soon gives way to harmonic
oscillation. Also, the higher
harmonics decay more quickly
than the lower frequencies.
|

|


