Time Varying Spectra
The Sonogram
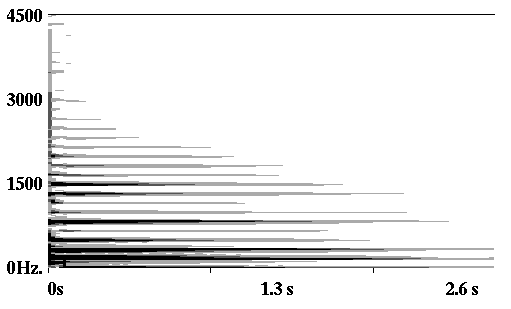
Sonogram plot of single guitar tone, showing frequency
on the vertical axis and time on the horizontal axis.